
Best States for Teachers in 2025
Nationwide teaching shortages in 2025 mean plenty of opportunities for teachers to make a difference with students. Still, finding the right position can feel overwhelming. As inflation turns record-high educator salaries into the lowest spending power in a decade, teachers are on the lookout for jobs that give them the resources to thrive.
So which states are keeping teachers top of mind this year? To spotlight the best states for teachers, Insurance Canopy compared 50 states based on five key wage and classroom factors. (Check out our Methodology at the bottom of the page for a full explanation of rankings and data.)
Find out which teaching salaries keep up with inflation, which classrooms offer the best student-to-teacher ratio, and which states put educators first in 2025.

Key Findings
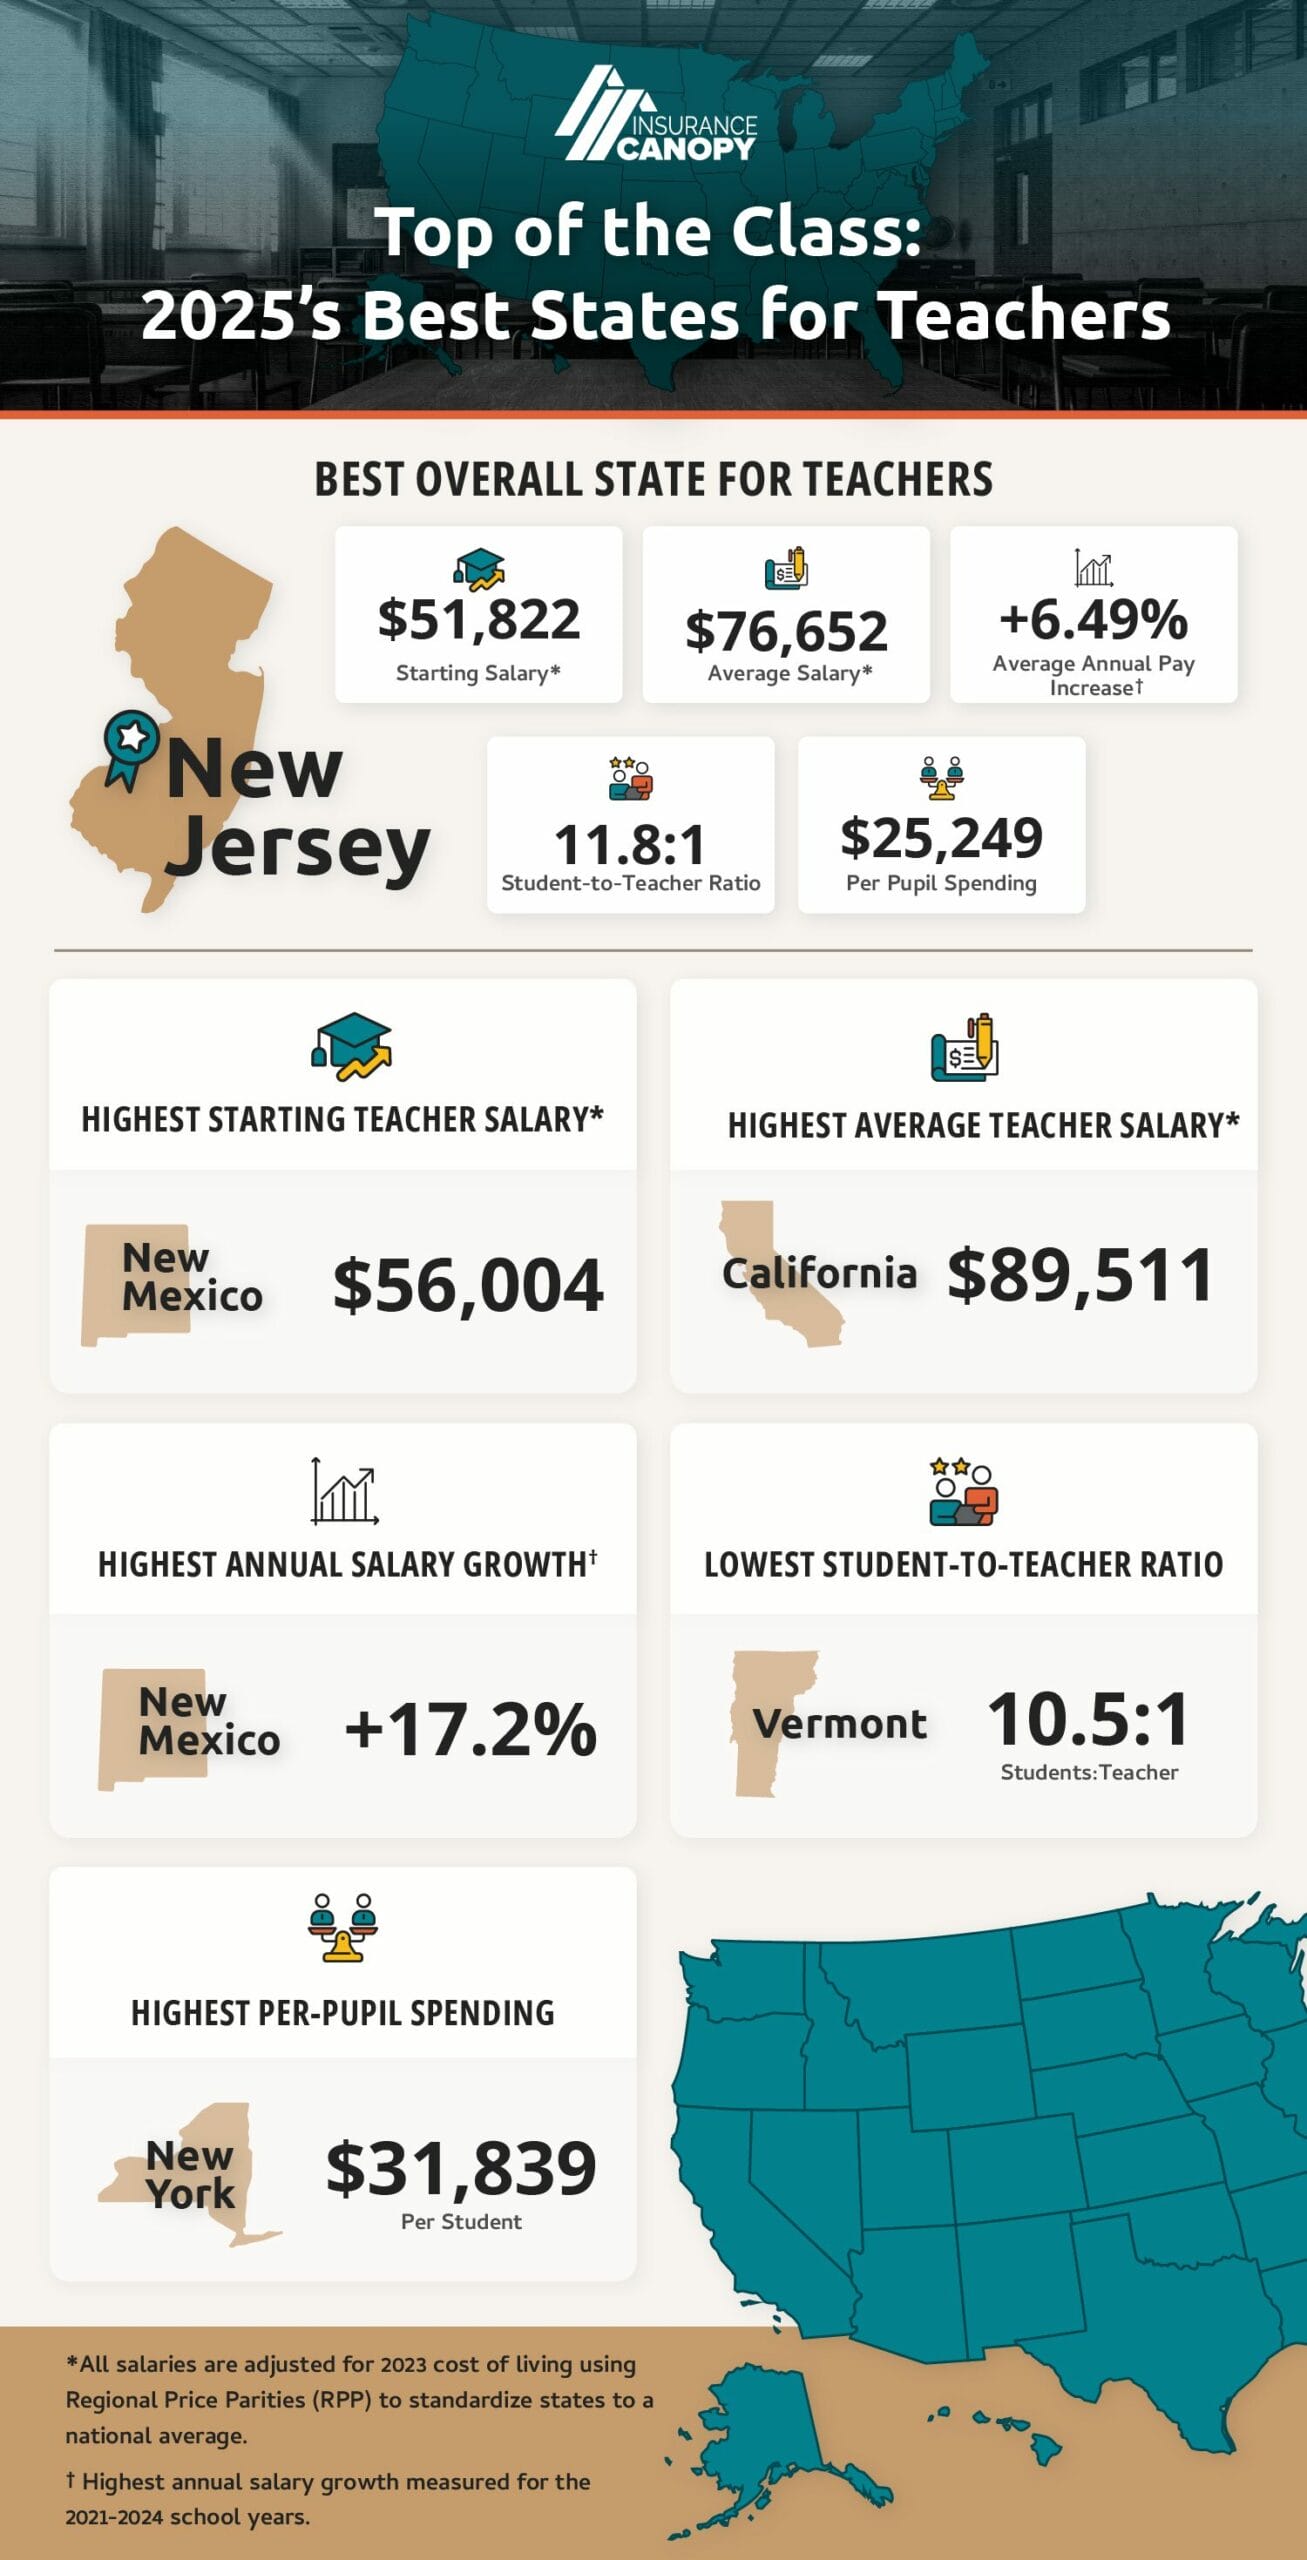
Table of Contents
Rankings Table: The Best States for Teachers
Here are Insurance Canopy’s best states for teachers, ranked from the best at number 1 to the worst at number 50.
Which categories are most important to you? The table defaults to our official scores, but you can also create personalized rankings around what you care about most.
Desktop: Adjust the slider for each metric to change how much it weighs in the overall score.
Mobile: Click “show controls” to display sliders and adjust each variable however you like.
| Overall Rank | State | Avg Starting Salary | Avg Overall Salary | Annual Salary Growth % | Student-to-Teacher Ratio | Spending Per Pupil |
|---|---|---|---|---|---|---|
| 0 | Alabama | 48532 | 68791 | 10.79 | 17.9 | 13176 |
| 0 | Alaska | 50351 | 76834 | 5.36 | 18.3 | 20638 |
| 0 | Arizona | 43644 | 62032 | 10.46 | 22.8 | 11234 |
| 0 | Arkansas | 43823 | 63807 | 4.91 | 12.7 | 12986 |
| 0 | California | 49097 | 89511 | 13.88 | 21.8 | 18597 |
| 0 | Colorado | 38505 | 67699 | 14.09 | 16.3 | 16573 |
| 0 | Connecticut | 47043 | 83424 | 6.56 | 11.7 | 24681 |
| 0 | Delaware | 45507 | 71688 | 6.38 | 14.2 | 17361 |
| 0 | Florida | 45583 | 52092 | 4.62 | 18.3 | 13368 |
| 0 | Georgia | 42552 | 69949 | 8.68 | 14.4 | 14311 |
| 0 | Hawaii | 46154 | 68344 | 10.78 | 14.2 | 20485 |
| 0 | Idaho | 45054 | 67304 | 13.43 | 17.5 | 9935 |
| 0 | Illinois | 43999 | 76428 | 4.52 | 13.7 | 21596 |
| 0 | Indiana | 46350 | 64049 | 8.11 | 15.8 | 13059 |
| 0 | Iowa | 45029 | 70302 | 4.78 | 14.1 | 13896 |
| 0 | Kansas | 45778 | 64582 | 5.2 | 12.9 | 14819 |
| 0 | Kentucky | 43319 | 64448 | 6.87 | 15.3 | 14039 |
| 0 | Louisiana | 51634 | 62322 | 4.64 | 17.5 | 17541 |
| 0 | Maine | 42392 | 63216 | 5.96 | 11.4 | 21019 |
| 0 | Maryland | 49565 | 81094 | 11.31 | 14.3 | 18114 |
| 0 | Massachusetts | 47188 | 87436 | 5.66 | 12 | 24861 |
| 0 | Michigan | 42783 | 72343 | 5.03 | 16.7 | 15473 |
| 0 | Minnesota | 43883 | 73522 | 7.02 | 15.5 | 16593 |
| 0 | Mississippi | 48495 | 64079 | 16.78 | 13 | 12490 |
| 0 | Missouri | 40119 | 60632 | 6.06 | 12.8 | 13586 |
| 0 | Montana | 38222 | 63809 | 7.32 | 13.7 | 14464 |
| 0 | Nebraska | 41811 | 66636 | 4.91 | 13.8 | 15896 |
| 0 | Nevada | 45046 | 65193 | 9.4 | 21 | 11927 |
| 0 | New Hampshire | 39497 | 63789 | 6.99 | 11.5 | 21585 |
| 0 | New Jersey | 51822 | 76652 | 6.49 | 11.8 | 25245 |
| 0 | New Mexico | 56004 | 70358 | 17.19 | 14.6 | 14747 |
| 0 | New York | 45832 | 86629 | 2.32 | 11.7 | 31839 |
| 0 | North Carolina | 42652 | 61947 | 6.25 | 15.4 | 13476 |
| 0 | North Dakota | 47848 | 66772 | 4.96 | 12.4 | 17364 |
| 0 | Ohio | 43633 | 73827 | 5.31 | 16.4 | 15395 |
| 0 | Oklahoma | 43253 | 68693 | 10.68 | 16.6 | 11311 |
| 0 | Oregon | 40162 | 70820 | 5.32 | 18.7 | 16507 |
| 0 | Pennsylvania | 50342 | 78105 | 4.22 | 13.3 | 20907 |
| 0 | Rhode Island | 45430 | 81054 | 6.94 | 12.7 | 21320 |
| 0 | South Carolina | 45092 | 64142 | 9.06 | 14 | 13639 |
| 0 | South Dakota | 48703 | 61568 | 7.21 | 13.8 | 12956 |
| 0 | Tennessee | 45583 | 60969 | 5.84 | 15.3 | 12288 |
| 0 | Texas | 48555 | 64262 | 6.07 | 14.8 | 11713 |
| 0 | Utah | 52163 | 69472 | 10.6 | 22.2 | 9891 |
| 0 | Vermont | 44567 | 72010 | 8.42 | 10.5 | 27403 |
| 0 | Virginia | 45929 | 64606 | 6.01 | 13.6 | 15321 |
| 0 | Washington | 51226 | 81034 | 7.97 | 17.2 | 20298 |
| 0 | West Virginia | 44921 | 61822 | 10.34 | 13.5 | 15797 |
| 0 | Wisconsin | 44201 | 68163 | 4.51 | 13.7 | 16147 |
| 0 | Wyoming | 53548 | 69188 | 3.3 | 12.6 | 20693 |
Duplicate rankings indicate a tie due to the same data for multiple states.
In-Depth Look at the Top 5 States for Teachers

1. New Jersey
The ultimate proof that slow and steady wins the race, New Jersey is the best state for teachers in 2025. It lands near the top of each category thanks to a consistent focus on educational spending and support for teachers.
At $51,822, New Jersey has the #4 starting salary adjusted for cost of living (and the highest unadjusted pay). 16% of New Jersey school districts offer a starting wage of at least $60,000. It’s also tenth in average salary, so pay scales with experience. Salary improvement is the only metric where this overachiever lands in the middle of the pack at #26.
New Jersey also spends the third most per student and is sixth in the nation for student-teacher ratio, lower than less-populated surrounding states like Delaware and Rhode Island. The secret: state laws that devote significant resources to capping class sizes, especially for early grades.
2. New Mexico
New Mexico is the second-best state for teachers and has the highest annual salary growth from 2021 to 2024. It tops the list for year-over-year salary increase at an impressive 17.2% and boasts the best teacher starting salary when adjusted for inflation.
New Mexico’s rapid improvement shows just how quickly positive change can happen. The state followed up historic increases in teacher base pay at all licensure levels in 2022 with a 7% bump in the educational budget and a further 6% raise for all educators in 2023.
The state has some ground to make up with continued improvement in overall teacher salary (#18), student-to-teacher ratio (#29), and per-pupil spending (#30), but the outlook is bright. Educational reforms are set to continue in New Mexico through 2025.


3. New York
New York is the third-best state for teachers in 2025 due to its strong infrastructure and educational budget. The nation’s largest school system is supported by the highest per-pupil spending in the country, along with an almost $25 billion education budget. Even with 1.1 million students in 1,700 public schools, the student-to-teacher ratio remains impressively low at 11.7:1.
New York’s average salary, adjusted for cost of living, is #3 overall at an attractive $86,629 for experienced teachers. Cost-adjusted starting salary remains middling at $45,832, and pay increases were the lowest in the country in the 2022–23 school year, up just 2.32% from the previous year.
In late 2023, the Empire State ratified a five-year contract raising teacher wages 3% each year for the next three years. This would still put the state in the lowest quadrant for salary improvement nationwide. Educators considering a New York teaching position should watch closely to see how new guidelines affect teachers.
4. Massachusetts
Massachusetts is the fourth-best state for teachers. The current holder of the nation’s highest SAT and ACT test scores, Massachusetts values its high graduation statistics and student achievement. It’s #4 in the nation for per-pupil spending and features the seventh best student-to-teacher ratio at 12:1.
Massachusetts is also a great place to be a veteran teacher, with the second-highest average teacher pay. Entry-level teachers will earn an above-average starting salary of $47,188. That’s the 16th best in the US, factoring in Massachusetts’ cost of living (the nation’s fourth highest).
Salaries went up 5.66% year-over-year from 2021-2022 to 2022-2023, a below-average growth rate. Current or hopeful Massachusetts teachers should watch a bill backed by the Massachusetts Teachers Association to guarantee teachers a starting $70,000 salary and an inflation-adjustment raise in 2030.


5. Connecticut
With high marks across the board, Connecticut’s consistent report card makes it the fifth-best state for teachers. It scores in the top 10% in the nation for both student-per-teacher ratio and per-pupil spending.
Despite having the fifth-highest cost of living in the US, Connecticut compares well to other states on teacher salary. It shines as a destination for experienced educators, with the fourth-highest average salary in the country. The starting salary for Connecticut teachers is in the top 34% nationwide, and salary growth is average, taking spot number 25 on our list.
However, Connecticut teachers still feel the nationwide struggle to keep educator salaries on pace with inflation. MIT calculates the living wage in Connecticut as $50,190 per year for a single person. New teachers earn $48,784 on average, unadjusted for cost of living. Introduced in March 2024, Senate Bill 381 would raise teachers’ starting wage to $60,000 if successful.
Ask a Teacher: What Makes a State a Good Place to Work?
Data gives context to whether an open job is as good as it sounds, but teachers should never underestimate the combined wisdom of their own connections. Asking trusted colleagues a few pointed questions adds experiential insight that’s hard to capture in numbers. Here’s what teachers across different states, grade levels, and career experience had to say about the best environments for teaching.

If you could go back with the knowledge you have now, what would you have done differently when choosing your first teaching job?
Which factors most differentiate your positive teaching experiences from your negative ones?
What can school administrators do to make open jobs more attractive to teachers?
How can states make teaching opportunities more attractive?
Other Green Flags for Teaching Jobs
Along with checking classroom management factors like workload, resources, and salary, educators mention a few other items on their wish lists. While we could not fairly include them in our ranking of best states for teachers since they vary by district, these are some of the most impactful benefits for teachers:
Health Insurance
Teacher healthcare insurance commonly includes medical, dental, and vision plans. Look for a blend of affordable payments (ideally employer-subsidized ones to lower your cost), a good selection of local in-network providers, and the additional benefits that matter to you (like prescription drug plans and Health Savings Accounts).
Retirement Benefits
Professional Liability Insurance
Educational lawsuits are on the rise, so professional liability insurance is crucial financial protection for teachers. Most full-time K-12 teachers can get liability insurance through their district, union, or teaching association, but it’s important to know where these plans fall short.
Substitute and part-time teachers may not be eligible for their district’s policy, and even coverage for full-time teachers can have major limitations. Teachers often need their own liability insurance to be fully covered. Check whether you are a named insured on your institution’s or district’s plan and consider buying your own teacher insurance.
Methodology
Data for this report was sourced on February 2, 2025 from government, teacher association, and educational news sources, as indicated below.
To choose the most important ranking factors for teachers, Insurance Canopy drew on the RAND 2024 State of the American Teacher Survey and comments from self-conducted teacher interviews. We decided on the five metrics weighted as shown below and used the most complete, recent data set available for each category.
Starting Teacher Salaries Adjusted for Cost of Living (May 2023): 25%
To measure pay competitiveness based on tenure only, we used NEA starting salary data for K-12 public school teachers with Bachelor’s degrees. Excluding more advanced degrees eliminates higher outlying data and best captures the position of an entry-level teacher at the minimum license requirement.
We decided to weigh starting teacher salary more heavily than average salary (or any other metric) for two reasons:
- Teachers just starting out have the greatest capacity for relocation they are likely to have in their careers. As a result, we wanted to focus on the most immediately relevant data.
- Educators don’t get to become higher-paid veterans if they can’t make it financially through their first years. If teachers can’t justify staying in the profession long enough to earn more, they will never see their salary potential.
Estimated Average Teacher Salaries Adjusted for Cost of Living (May 2024): 20%
Pay is top-of-mind for most teachers in 2025, as no state’s teacher salary currently keeps up with inflation. 2024’s record-setting 3.9% bump in the average educator starting salary was the largest in 14 years, but teachers are still making 5% less than they did 10 years ago due to inflation.
We weighed average salary heavily to show which states have made the most effort to shrink the gap between actual wages and inflation-matched pay for teachers.
Still, we chose to give this metric less weight than starting teacher salaries. Considering the likelihood of continued cost of living and inflation adjustments, the percentage increase in salary and estimated average teacher salary together paint the most compelling picture of long-term well-being. However, neither single metric means as much to teachers as a great starting salary.
Source: NEA 2024 Educator Pay Data: Teacher Pay & Per Student Spending
Percentage Increase in Teacher Salary (2021-2024 School Years): 15%
Steady salary increases keep teaching wages livable and make a state’s educational programs competitive. Year-over-year growth lets teachers track which states have taken action over time to prioritize educators. Our data reflects year-over-year salary change from the past three full school years to highlight the most recent state initiatives.
Source: NEA 2024 Educator Pay Data: Teacher Pay & Per Student Spending
Ratio of Students Per Teacher (2022-2023): 20%
While research shows a tenuous link between class size and student achievement, results are more consistent for teachers. Smaller classroom sizes lead to higher teacher satisfaction, a more manageable workload, and improved relationships with students.
However, a low student-to-teacher ratio can be a double-edged sword. Fewer students per teacher often means lower pay as schools with more employees try to balance their budgets. We elevated states that balance workload and salary most effectively by ranking NCES students-per-teacher data and teacher salaries at equal weight.
Source: NCES Common Core of Data: Public Elementary and Secondary Schools Pupil/Teacher Ratio, 2022-23
Per Pupil Spending (2023-2024): 20%
States that invest in better resources and learning environments demonstrate their commitment to education and educators. Better-equipped classrooms can also mean fewer supplies teachers pay for out of pocket and more learning modalities through access to technology.
Note: Per-pupil spending is a state-wide average that doesn’t guarantee equal distribution of resources across schools and districts.
Source: NEA 2024 Educator Pay Data: Teacher Pay & Per Student Spending
Data Adjustments
To usefully compare data from multiple criteria and local economies, we adjusted some data factors across the board:
- All dollar amounts are adjusted for cost of living: We used the BEA 2023 Regional Price Parities (RPPs) to factor in cost of living before ranking rather than displaying most and least expensive states as a separate metric. This step more clearly compares how teachers’ starting and average salaries translate into relative quality of life.
- All values are normalized: We normalized all data once adjusted for cost of living. This made it possible for us to translate radically different measurements into scores we could compare and combine into a state ranking on equal terms.
Acknowledgments
Special thanks to the educators who provided their expert testimonials: Kay F., Meco G., Kayla B., Stephen S., Andrea N., Seth W., and Dennis Shirshikov of itutor.com.